
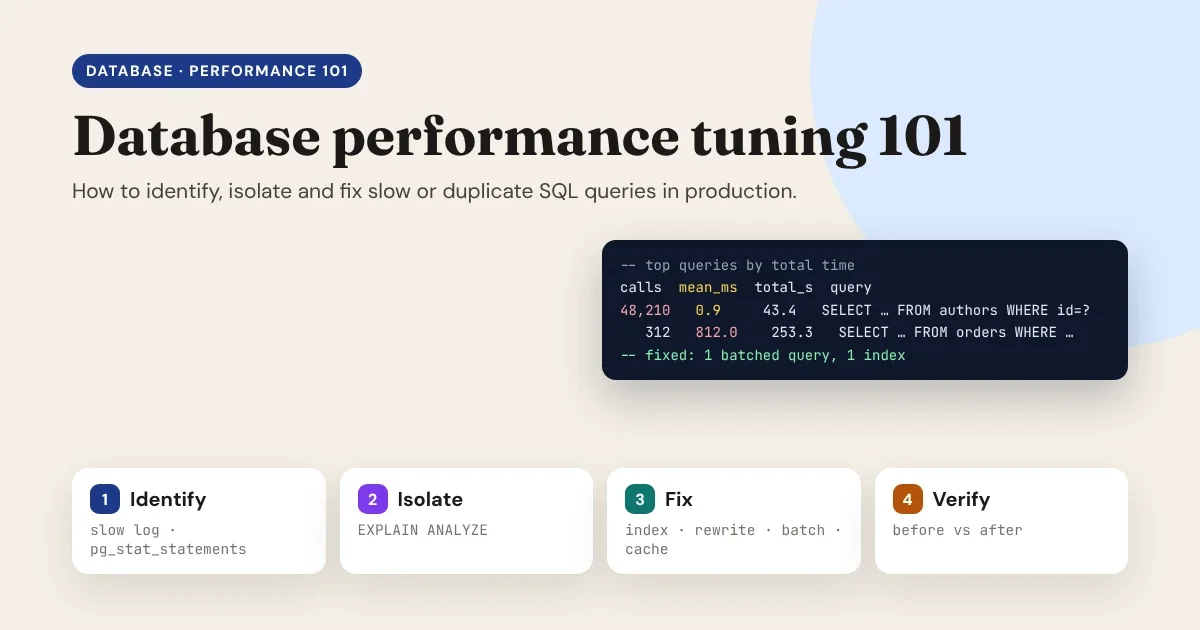
Most slow websites aren't slow because the server is too small. They're slow because a handful of database queries do far more work than they need to, or run far more often than they should. This guide walks through a simple, repeatable loop for finding those queries in production, understanding why they're slow, fixing them safely, and proving the fix worked. Examples cover MySQL / MariaDB (which WordPress uses) and PostgreSQL.
Slow databases are rarely a hardware problem. They’re usually a few queries doing too much work, or running too many times.
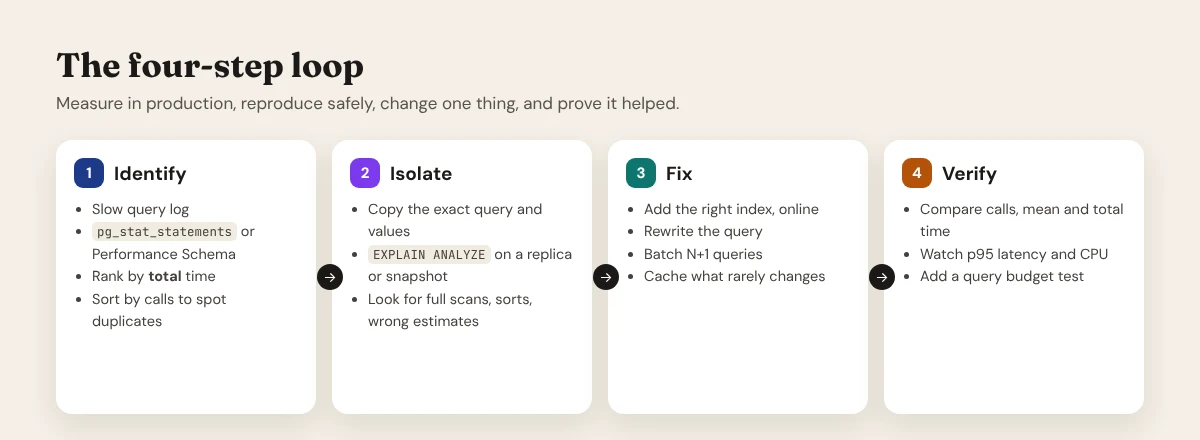
- Identify the queries that cost the most total time.
- Isolate why, with the execution plan.
- Fix one thing at a time, then verify with the same numbers.
The loop
Before you start: three rules for working in production
- Measure before you change anything. Guessing leads to indexes nobody uses and "optimisations" that make things worse.
- Reproduce on a copy, not on the live database. Use a read replica or a recent snapshot with production-sized data. An empty development database will lie to you: with 50 rows, every query is fast.
- Change one thing at a time. Then you know what helped, and you can undo what didn't.
Step 1: Identify the queries that matter
Rank by total time, not just by slowest
A query that takes 800 ms but runs 300 times a day matters less than a 1 ms query that runs 50,000 times an hour. What hurts your site is total time = number of calls × average time. Sort by that first. Then sort by number of calls to spot duplicates.
MySQL and MariaDB: the slow query log
Turn on the slow query log to record every query slower than a threshold. You can switch it on without a restart:
SET GLOBAL slow_query_log = 'ON';
SET GLOBAL long_query_time = 0.5;               -- seconds; new connections pick it up
SET GLOBAL log_queries_not_using_indexes = 'ON'; -- optional: noisy, but revealing
SHOW VARIABLES LIKE 'slow_query_log_file';      -- where the log is written
Make it permanent in your server's my.cnf once you're happy with the settings. Then summarise the log with pt-query-digest from the free Percona Toolkit, which groups identical queries and ranks them by total time:
pt-query-digest /var/lib/mysql/your-host-slow.log > slow-report.txtOn MySQL 8 you can get the same ranking without a log file, from the Performance Schema:
SELECT DIGEST_TEXT,
       COUNT_STAR                          AS calls,
       ROUND(SUM_TIMER_WAIT / 1e12, 2)     AS total_s,
       ROUND(AVG_TIMER_WAIT / 1e9, 2)      AS avg_ms,
       SUM_ROWS_EXAMINED, SUM_ROWS_SENT
FROM performance_schema.events_statements_summary_by_digest
ORDER BY SUM_TIMER_WAIT DESC
LIMIT 10;
A big gap between rows examined and rows sent is a strong hint: the database reads thousands of rows to return ten.
PostgreSQL: pg_stat_statements
pg_stat_statements is the single most useful tool for PostgreSQL performance. Enable it once (this needs one restart):
-- postgresql.conf:  shared_preload_libraries = 'pg_stat_statements'
CREATE EXTENSION IF NOT EXISTS pg_stat_statements;
Then list the queries with the highest total time:
SELECT query,
       calls,
       round(total_exec_time::numeric, 1) AS total_ms,
       round(mean_exec_time::numeric, 2)  AS mean_ms,
       rows
FROM pg_stat_statements
ORDER BY total_exec_time DESC
LIMIT 10;
(On PostgreSQL 12 and older, the columns are called total_time and mean_time.) Change ORDER BY total_exec_time to ORDER BY calls to find queries that run suspiciously often. To log individual slow queries as well:
ALTER SYSTEM SET log_min_duration_statement = '500ms';
SELECT pg_reload_conf();
WordPress: Query Monitor
On a WordPress site, the free Query Monitor plugin shows every query a page runs, which plugin or theme ran it, how long it took, and a Duplicate Queries panel. Use it on a staging copy, or only while logged in as an administrator. Don't leave debugging tools such as SAVEQUERIES switched on in production.
Application monitoring
APM tools (Datadog, New Relic, Sentry, or OpenTelemetry with your own backend) connect slow queries to the page or API endpoint that caused them, which makes the next step much faster.
Step 2: Isolate why a query is slow
Take one query from your list, with real values, and look at its execution plan: the steps the database takes to answer it.
-- PostgreSQL
EXPLAIN (ANALYZE, BUFFERS) SELECT … ;

-- MySQL 8.0.18 and later
EXPLAIN ANALYZE SELECT … ;

-- MariaDB
ANALYZE FORMAT=JSON SELECT … ;Never trust a guess about a slow query. The execution plan tells you exactly what the database is doing, and what it’s doing that it shouldn’t.
Read the plan
ANALYZE actually runs the query. For an UPDATE or DELETE, wrap it in a transaction and roll it back:
BEGIN;
EXPLAIN ANALYZE UPDATE orders SET status = 'archived' WHERE created_at < '2025-01-01';
ROLLBACK;
What to look for in the plan
- Full table scans on large tables:
Seq Scanin PostgreSQL,type: ALLor "Table scan" in MySQL. Usually a missing or unusable index. - Rows examined far above rows returned. The database reads a lot to return a little.
- Sorting and temporary tables:
Sortwith a large row count, or MySQL's "Using filesort" / "Using temporary". An index in the right order can often remove the sort. - Estimates far from actual rows. If the planner expects 10 rows and gets 100,000, its statistics are stale. Run
ANALYZE(PostgreSQL) orANALYZE TABLE(MySQL) and check again. - Nested loops over big sets. Fine for a few rows, painful for thousands.
- Waiting, not working. If a query is sometimes fast and sometimes slow, it may be blocked by locks. Check
pg_stat_activityandpg_locksin PostgreSQL, orSHOW ENGINE INNODB STATUSandsys.innodb_lock_waitsin MySQL.
Step 3: Fix it
Fix 1: Add the right index, without locking the table
Most slow queries are fixed by one well-chosen index. For a composite index, put columns compared with = first, then the column used for a range or sort:
-- The slow query
SELECT id, total FROM orders
WHERE status = 'paid' AND created_at >= '2026-10-01'
ORDER BY created_at DESC
LIMIT 50;

-- PostgreSQL: build it without blocking writes
CREATE INDEX CONCURRENTLY idx_orders_status_created ON orders (status, created_at);

-- MySQL (InnoDB): online index build
ALTER TABLE orders ADD INDEX idx_orders_status_created (status, created_at),
  ALGORITHM=INPLACE, LOCK=NONE;
CREATE INDEX CONCURRENTLY takes longer and can't run inside a transaction block, but your site keeps working while it builds. For very large MySQL tables, tools such as gh-ost or pt-online-schema-change copy the table in the background. Remember that every index slows down writes a little and takes disk space: add indexes for queries that matter, and remove ones nothing uses.
Fix 2: Rewrite queries the index can't help
Some queries can't use an index as written:
-- Can't use an index on created_at: the function hides the column
WHERE DATE(created_at) = '2026-11-01'
-- Can: a range on the raw column
WHERE created_at >= '2026-11-01' AND created_at < '2026-11-02'
Other common rewrites:
- Select only the columns you need.
SELECT *reads and sends data nobody uses, and prevents index-only scans. - A leading wildcard can't use a normal index:
LIKE '%term'. Use full-text search for "contains" searches. - Match data types. Comparing a text column with a number (or the reverse) can force a conversion on every row.
- Replace deep
OFFSETpagination with keyset pagination, which stays fast on page 1,000:
-- Slow on deep pages: the database still reads and discards every skipped row
SELECT id, title FROM posts ORDER BY created_at DESC, id DESC LIMIT 20 OFFSET 20000;

-- Fast: continue after the last row of the previous page
SELECT id, title FROM posts
WHERE created_at < :last_created_at
   OR (created_at = :last_created_at AND id < :last_id)
ORDER BY created_at DESC, id DESC
LIMIT 20;
Fix 3: Remove duplicate queries (the N+1 problem)
The most common cause of duplicate queries is the N+1 problem: one query loads a list, then one more query runs for each item in it.
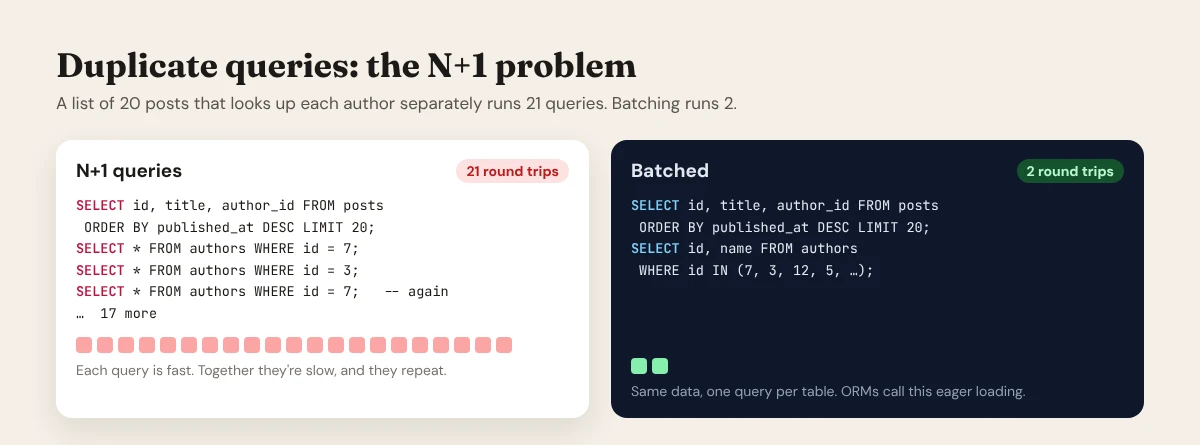
Each query is fast, so none of them shows up as "slow". Together they add round trips, load and latency, and they're easy to spot in Step 1 as queries with a huge number of calls. The fix is to load related data in one batch:
SELECT id, title, author_id FROM posts ORDER BY published_at DESC LIMIT 20;
SELECT id, name FROM authors WHERE id IN (7, 3, 12, 5);   -- the authors of those 20 posts
Every major ORM can do this for you, a technique usually called eager loading:
| Framework | N+1 (avoid) | Batched (use) |
|---|---|---|
| Django | post.author in a loop |
Post.objects.select_related('author') |
| Rails | post.author in a loop |
Post.includes(:author) |
| Laravel | $post->author in a loop |
Post::with('author')->get() |
| Prisma | findUnique per post |
prisma.post.findMany({ include: { author: true } }) |
Other sources of duplicates: the same settings or user record loaded several times per request (keep it in memory for the request), and loops that save one row at a time (use one multi-row insert or update).
Fix 4: Cache what rarely changes
Some data is read constantly and changes rarely: menus, settings, product lists, rendered pages. Cache it:
- In the application, in Redis or Memcached, with a clear expiry or invalidation when the data changes.
- WordPress: a persistent object cache (Redis or Memcached) stops the same lookups from hitting the database on every page view, and full-page caching serves most visitors without touching PHP or MySQL at all.
- At the edge: a CDN can serve whole pages without your server being involved.
Note that MySQL 8 removed the old built-in query cache: caching now belongs in your application or in front of it.
Fix 5: Check the server settings last
Configuration tuning helps, but rarely fixes a bad query. Common checks:
- MySQL / InnoDB:
innodb_buffer_pool_sizelarge enough to keep your working data in memory. On a dedicated database server this is often set to around half to three-quarters of the RAM. - PostgreSQL:
shared_buffers(often about a quarter of RAM as a starting point),work_memfor sorts and joins, and connection pooling with PgBouncer if you have many short connections. - Fresh statistics: make sure autovacuum (PostgreSQL) and statistics updates are running, so the planner makes good choices.
- WordPress: keep autoloaded options small. This shows how much is loaded on every page:
SELECT ROUND(SUM(LENGTH(option_value)) / 1024) AS autoload_kb
FROM wp_options
WHERE autoload IN ('yes', 'on', 'auto', 'auto-on');
If that's several megabytes, an old or uninstalled plugin has probably left large options set to load on every request.
Step 4: Verify, and stop regressions
- Compare before and after in the same tool you used in Step 1: calls, mean time and total time for the query you changed.
- Watch the whole system: p95 response time, database CPU and I/O. An index that speeds up one query can slow down heavy writes.
- Reset the counters after a fix, so the next ranking reflects the new state:
SELECT pg_stat_statements_reset();in PostgreSQL, or truncate the Performance Schema summary table in MySQL. - Add a query budget to your tests. For example, Django's
assertNumQueriesfails a test if a page suddenly runs more queries than expected, which catches new N+1 problems before they reach production. - Keep the slow query log on with a sensible threshold, and review it regularly.
Production safety checklist
- Run heavy analysis on a replica or snapshot, not the primary.
- Wrap
EXPLAIN ANALYZEon writes inBEGIN … ROLLBACK. - Build indexes online (
CONCURRENTLY,LOCK=NONE, gh-ost). - Set a statement timeout for ad-hoc sessions (PostgreSQL
SET statement_timeout = '30s';) so a mistake can't run for hours. - Have a recent, tested backup before schema changes.
- Change one thing at a time, and write down what you changed.
A fix you can’t measure is a fix you can’t trust. Compare the same numbers before and after, and add a test so the problem can’t quietly return.
Prove it
The fastest query is the one you never run
The best database tuning often happens one level up. If most of your pages show the same content to every visitor (articles, product pages, landing pages) there's no reason to query the database on every visit.
That's the idea behind pre-rendered pages. Sites built with Canvasly Web Studio are compiled to static HTML, so a typical page view doesn't touch a database at all. With headless WordPress, Canvasly's Next.js or Astro front end keeps WordPress for editing, but renders pages ahead of time and refreshes them when you publish. WordPress's database is busy when your team writes, not every time a visitor reads. See How to set up headless WordPress with Next.js or Astro and Minimalist web stack vs. heavy page builders.
Cheat sheet
| Task | MySQL / MariaDB | PostgreSQL |
|---|---|---|
| Find slow queries | Slow query log + pt-query-digest |
log_min_duration_statement |
| Rank by total time and calls | performance_schema.events_statements_summary_by_digest |
pg_stat_statements |
| See the plan | EXPLAIN ANALYZE (MySQL 8.0.18+), ANALYZE (MariaDB) |
EXPLAIN (ANALYZE, BUFFERS) |
| Add an index online | ALGORITHM=INPLACE, LOCK=NONE, gh-ost |
CREATE INDEX CONCURRENTLY |
| Refresh statistics | ANALYZE TABLE t; |
ANALYZE t; |
| Find blocking locks | sys.innodb_lock_waits |
pg_stat_activity, pg_locks |
| Limit runaway queries | MySQL: SET SESSION max_execution_time = 30000; (ms, SELECT only); MariaDB: SET SESSION max_statement_time = 30; (seconds) |
SET statement_timeout = '30s'; |
Conclusion
Database tuning isn't magic, and it rarely needs a bigger server. Identify the queries that cost the most total time, isolate why with the execution plan, fix them with the right index, a better query, batching or caching, and verify the result with the same numbers you started with. Do that loop a few times and most "slow database" problems disappear, and the duplicate queries go with them.
Want pages that don't need the database at all? Try Canvasly Web Studio free for 7 days at canvasly.pro.